
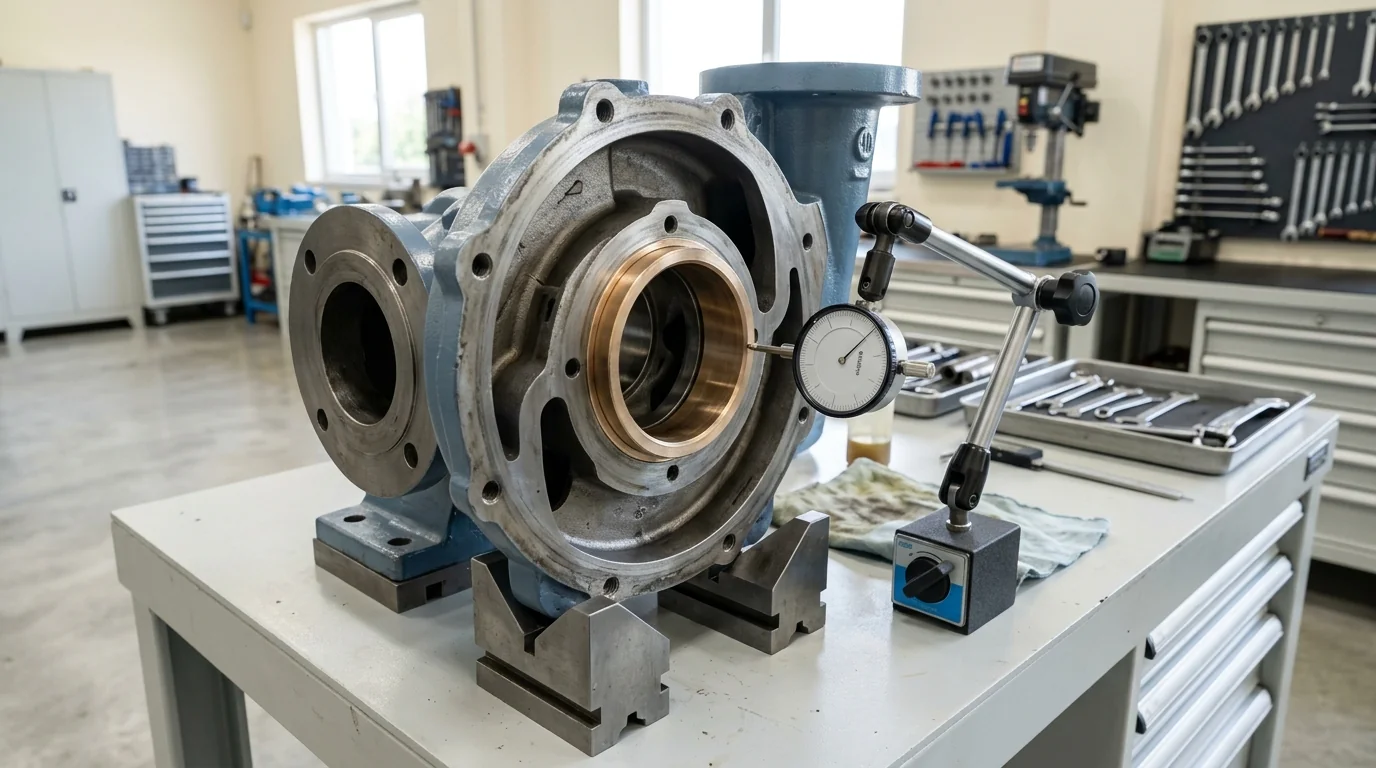
Pump Efficiency Calculator: Spot Internal Mechanical Wear Before Catastrophic Failure Manual
A definitive plant energy engineering manual, hydraulic efficiency mathematical derivation standard, and condition-based predictive maintenance guide for process engineers, energy auditors, and plant maintenance superintendents across Vatva GIDC, Narol, Odhav, Surat, and Gujarat.
Quick Answer
In the energy-intensive chemical manufacturing complexes, continuous textile dyehouses, pharmaceutical bulk drug units, and common effluent treatment plants (CETP) of Gujarat—spanning Ahmedabad (Vatva GIDC, Narol, Odhav), Surat, Ankleshwar, and Dahej—centrifugal pumps consume massive electrical power. When a pump operates continuously, internal mechanical and hydraulic degradation silently erodes operating efficiency (η) long before catastrophic bearing or mechanical seal failure occurs. Tracking pump efficiency provides the earliest, most reliable predictive indicator of internal component wear. The fundamental governing relationship is \eta_pump = (P_hydraulic) / (P_shaft) = [Q_m³/h · H_meters · Specific Gravity] / [367.12 · P_shaft (kW)], while overall electrical grid efficiency is given by the Wire-to-Water formula \eta_wire-to-water = (P_hydraulic) / (P_electric). A gradual drop of 8%-15% in pump efficiency typically indicates doubled internal wear ring clearances, impeller vane cavitation erosion, or volute encrustation, costing plants lakhs in excess electrical utility charges. Sizing, calculating, and diagnosing centrifugal pump efficiency requires strict engineering rigor conforming to ISO 5199, ISO 2858, and DIN 24255 standards.
Key Takeaways
- Master the Metric Pump Efficiency Formula. Use \eta_pump = [Q_m³/h · H_meters · SG] / [367.12 · P_shaft (kW)] to determine actual operating hydraulic efficiency.
- Audit Wire-to-Water Efficiency. Calculate total electrical energy conversion via \eta_wire-to-water = [Q · H · SG] / [367.12 · (√(3) · V · I · \cosφ × 10^-3)].
- Identify Wear Ring Bypass Early. An internal radial clearance increase from 0.25 mm to 0.70 mm causes a 10%-15% drop in pump volumetric efficiency.
- Schedule Overhauls on Efficiency Drops. A measured efficiency loss exceeding 8% justifies immediate mechanical refurbishment through energy payback calculations.
Introduction
Across Gujarat's manufacturing belts—including the specialty chemical and dye synthesis plants of Vatva GIDC, Odhav, and Ankleshwar, the continuous textile mills of Narol and Surat, and the large-scale petrochemical terminals of Dahej—industrial pumps account for more than 25% of total plant electrical utility costs.
Over a pump's 15-year operational lifecycle, electrical energy consumption represents between 85% and 92% of total lifecycle cost, while initial purchase price represents less than 5%:
- The Hidden Energy Drain: A moderate 10% drop in operating efficiency on a continuously running 45 kW chemical transfer pump wastes over 39,000 kWh of electrical energy annually, adding more than 3.5 lakh INR in unnecessary utility bills.
- The Diagnostic Triad: Routine efficiency calculations combine flow measurements (Q), differential dynamic head (H), and True-RMS electrical power input (P_elec) to expose internal mechanical wear long before vibration or temperature alarms trigger.
- The Mechanical Degradation Path: Chemical corrosion, particulate abrasion, and off-design hydraulic recirculation continuously expand internal wear ring clearances, pit impeller vanes, and roughen casing volute surfaces.
- The Engineering Standard: Following ISO 5199, ISO 2858, and DIN 24255 standards—executing wire-to-water audits, measuring internal running clearances, restoring smooth hydraulic profiles, and dynamically balancing rotors—ensures peak energy efficiency and maximum reliability.
2. Master Centrifugal Pump Efficiency & Energy Loss Matrix
Review the standard efficiency benchmarks, component loss distributions, and wear triggers for industrial chemical pumps:
| Pump Rating / Flow Class | Expected New BEP Efficiency (\eta_new) | Refurbishment Threshold (\eta_wear) | Dominant Loss Component | Typical Annual Energy Waste at 10% Loss |
|---|---|---|---|---|
| Small Chemical (10 - 40 m³/h) | 58% - 68% | < 50% | Wear ring bypass / Disc friction | 12,000 kWh / year |
| Medium Process (40 - 150 m³/h) | 68% - 78% | < 60% | Volumetric slip / Vane erosion | 38,000 kWh / year |
| Large Utility (150 - 600 m³/h) | 78% - 85% | < 70% | Hydraulic friction / Casing scale | 95,000 kWh / year |
| Effluent Slurry (50 - 300 m³/h) | 55% - 65% | < 46% | Abrasive wear ring / Recirculation | 65,000 kWh / year |
3. The Fluid Dynamics Physics, Efficiency Math & Energy Loss Equations
Overall Pump Efficiency Decomposition (η = \eta_hyd · \eta_vol · \eta_mech)
Overall pump efficiency (\eta_pump) is the mathematical product of three distinct sub-efficiencies:
Interactive Drive Motor & Hydraulic Power Sizer
Live ISO 5199 / API 610 Dynamic Engine- Hydraulic Efficiency (\eta_hydraulic ≈ 0.80 - 0.92): Accounts for fluid friction against impeller vanes and casing walls, eddy turbulence, and shock losses at the vane inlet.
- Volumetric Efficiency (\eta_volumetric ≈ 0.88 - 0.98): Accounts for high-pressure discharge liquid leaking back to the suction eye through internal wear ring clearances:
- Mechanical Efficiency (\eta_mechanical ≈ 0.95 - 0.98): Accounts for mechanical friction in bearings, mechanical seal faces, and stuffing box packings.
Metric Hydraulic Efficiency Equation (\eta_pump = [Q · H · SG] / [367.12 · P_shaft])
Actual pump hydraulic efficiency (\eta_pump) is calculated from delivered flow (Q_m³/h), total dynamic head (H_meters), fluid specific gravity (SG), and shaft brake power (P_shaft (kW)):
- Practical Calculation:
- Measured flow Q = 120 m³/h. - Measured differential head H = 45 meters. - Pumping 33% HCl (SG = 1.16). - Measured shaft input power P_shaft = 22.5 kW.
Wire-to-Water Electrical System Efficiency (\eta_wire-to-water = (P_hyd) / (P_elec))
To evaluate total electrical-to-hydraulic efficiency directly from motor terminal readings without decoupling the shaft:
- Where:
- V is line-to-line voltage in Volts (V). - I is average line current in Amperes (A). - \cosφ is motor power factor.
- Note: \eta_wire-to-water = \eta_pump · \eta_motor · \eta_VFD.
Volumetric Slip & Wear Ring Clearance Leakage Math (Q_leakage = C_d · A · √(2g ΔH))
Internal bypass leakage (Q_leakage) across the annular wear ring clearance is given by the orifice flow equation:
- Where:
- D_ring is wear ring nominal diameter. - c_radial is radial running clearance. - ΔH_ring ≈ 0.75 × H_total is differential head across the wear ring. - C_d ≈ 0.60 is discharge coefficient.
- As radial clearance (c_radial) doubles from 0.25 mm to 0.50 mm, internal bypass leakage doubles, causing delivered flow and volumetric efficiency to plunge.
Lifecycle Energy Cost & Payback Equation (Cost = [P_elec · Hours · Tariff] / [η])
Annual electrical energy cost (INR / year) of operating an industrial pump is:
- Overhaul Payback Example:
- Upgrading an overhauled pump from η = 60% to η = 74% on a 50 kW continuous load (8000 hours/year at 8.50 INR/kWh):
- Complete pump mechanical refurbishment pays for itself in less than 2 to 3 months of operation.
4. The 6 Primary Causes of Centrifugal Pump Efficiency Degradation
Cause 1: Internal Wear Ring Radial Clearance Expansion & Bypass
- Mechanism: Corrosive acid attack or particulate abrasion erodes the close-running radial clearance between impeller neck and casing wear ring.
- Symptoms: Initial clearance (0.25 mm) expands to > 0.70 mm; up to 15% of pumped liquid bypasses back into suction eye; pump efficiency drops by 8%-14%.
- Fix: Machine impeller shroud and install new wear rings precision-machined to OEM radial clearances (0.20 - 0.30 mm).
Cause 2: Impeller Vane Leading Edge Cavitation Pitting & Erosion
- Mechanism: Persistent operation near low NPSHa margin causes micro-bubble implosion, eroding blade tips and destroying hydraulic camber.
- Symptoms: Hydraulic profile distorts; severe vortex turbulence at impeller inlet; efficiency drops by 6%-10%.
- Fix: Weld-repair or replace damaged impeller; polish vane surfaces; optimize suction piping to restore positive NPSH margin.
Cause 3: Volute Casing Encrustation & Hydraulic Surface Roughness
- Mechanism: Mineral scale precipitation, chemical crystallization, or tuberculation increases casing internal surface roughness (\varepsilon).
- Symptoms: Boundary layer friction head loss increases; hydraulic efficiency degrades by 4%-8%.
- Fix: Grit-blast internal volute casing; apply smooth hydrophobic ceramic composite coating to reduce skin friction.
Cause 4: Off-BEP Internal Recirculation & Vortex Dissipation
- Mechanism: Operating pump continuously below 50% BEP or in runout flow above 125% BEP.
- Symptoms: Internal fluid stalls and recirculates in impeller eye and discharge volute, converting motor energy directly into waste heat and vibration.
- Fix: Resize pump, trim impeller diameter, or install a VFD to shift operating point directly to 80%-100% BEP.
Cause 5: Mechanical Seal Face Drag & Bearing Friction Over-Greasing
- Mechanism: Overtightened mechanical seal spring compression or over-greased ball bearings generating high viscous churning drag.
- Symptoms: Bearing housing temperature spikes to > 85°C; mechanical efficiency drops by 2%-4%.
- Fix: Set correct seal working length and adhere to precision bearing lubrication intervals.
Cause 6: Electric Motor Stator Heating & Degraded Power Factor
- Mechanism: Motor operated in high ambient temperatures (> 45°C) or rewound multiple times with substandard copper windings.
- Symptoms: Motor efficiency drops from 94% (IE3) to < 86%; power factor collapses to \cosφ < 0.72.
- Fix: Replace degraded motor with a premium efficiency IE3 / IE4 motor conforming to IS 1520 and IS 5120 standards.
5. Step-by-Step Field Efficiency Auditing & Diagnostic SOPs
Execute this structured engineering protocol when auditing, calculating, or troubleshooting pump efficiency:
Phase 1: Precision Flow Rate & Differential Head Mapping SOP
- Flow Measurement: Measure actual delivered flow (Q_m³/h) using a calibrated ultrasonic clamp-on or electromagnetic flow meter.
- Differential Head Logging: Measure suction (P_s) and discharge (P_d) pressures using calibrated glycerine gauges; calculate total dynamic head (H = [ΔP] / [ρ· g]).
Phase 2: True-RMS Three-Phase Electrical Input Power Audit SOP
- Electrical Power Logging: Measure line voltages (V_RY, V_YB, V_BR), phase currents (I_R, I_Y, I_B), and power factor (\cosφ) with a True-RMS power analyzer.
- Grid Power Calculation: Compute total input kilowatt power (P_elec = √(3) · V_avg · I_avg · \cosφ × 10^-3).
Phase 3: Wire-to-Water & Pump Efficiency Calculation SOP
- Efficiency Calculation: Compute wire-to-water efficiency (\eta_wire-to-water) and pump shaft efficiency (\eta_pump = [\eta_wire-to-water] / [\eta_motor]).
- Curve Benchmark: Compare calculated efficiency against manufacturer original test curve; log efficiency delta (Δη).
Phase 4: Internal Wear Ring Metrology & Clearance Audit SOP
- Workshop Disassembly: Dismantle pump rotating element; clean and de-scale all internal passages.
- Micrometer Metrology: Measure casing wear ring ID and impeller wear ring OD; confirm diametrical clearance is < 0.35 mm. If clearance exceeds 0.60 mm, replace wear rings.
Phase 5: Dynamic Rotor Balancing to ISO 5199 Grade G2.5 SOP
- Dynamic Balancing: Mount refurbished impeller, shaft, and sleeve on balancing machine.
- Balance Certification: Achieve residual unbalance < 1.0 g\cdotmm/kg conforming to ISO 5199 Grade G2.5.
Phase 6: Laser Hot Alignment Verification & Re-Commissioning SOP
- Laser Alignment: Align pump and motor shafts using dual-laser alignment tool; achieve concentricity ≤ 0.03 mm.
- Re-Audit Verification: Re-commission pump under full process load; verify efficiency recovery, low motor current, and vibration < 1.80 mm/s RMS (Zone A).
6. Materials of Construction, Metallurgy & Efficiency Refurbishment Standards
Solid Nodular Ductile Iron & SS316 High-Efficiency Wet Ends
- Structural Hydraulics: Heavy-duty Nodular Ductile Iron (EN-GJS-400-18-LT / GGG 40.3) and investment cast SS316 casings precision-machined with smooth volute contours that minimize turbulent eddy dissipation.
Virgin PFA / Pure PTFE Linings for Smooth Hydraulic Pathways
- Fluoropolymer Wet Ends: Solid transfer-molded virgin PFA (3.5 - 5.0 mm) linings providing ultra-smooth internal surface finishes (Ra < 0.4 µm) that minimize boundary layer skin friction head loss in corrosive chemical service.
Monolithic Direct-Sintered Silicon Carbide (SSiC) Seal Faces
- Low-Friction Seals: Monolithic direct-sintered silicon carbide (SSiC) mechanical seal faces with diamond-like hardness and low sliding friction coefficients (µ< 0.04) to eliminate parasitic seal drag.
Hydrophobic Ceramic Internal Casing Coatings for Friction Reduction
- Efficiency Coatings: Ceramic-filled epoxy and polyurethane hydrophobic coatings applied to casing internal passages, reducing surface roughness and boosting hydraulic efficiency by 2%-5%.
7. The Maintenance Superintendent's Efficiency Degradation Decision Matrix
Follow this structured engineering guide when assessing pump efficiency degradation:
| Measured Efficiency Loss | Diagnostic Indicator | Confirmed Root Cause | Mandatory Corrective Engineering Action |
|---|---|---|---|
| Efficiency dropped 5% - 8% | Differential pressure slightly low | Initial wear ring clearance expansion | Schedule wear ring replacement during PM |
| Efficiency dropped > 12% | High motor current; low flow | Severe wear ring bypass (> 0.70 mm) | Immediate workshop overhaul & wear ring swap |
| Efficiency low; heavy vibration | High 1× and 2× blade pass vibration | Impeller vane cavitation pitting | Re-profile / Replace impeller; fix NPSHa |
| Power factor low (\cosφ < 0.72) | High current; motor surface > 90°C | Degraded motor / Partial off-load | Replace with IE3 / IE4 premium motor |
| High power draw; low discharge head | Operating point far right on curve | Off-BEP runout flow operation | Trim impeller diameter or throttle valve |
8. Worked Gujarat Chemical, Textile & Industrial Plant Case Studies
Case 1: Vatva GIDC Chemical Synthesis Reactor Acid Pump Efficiency Loss Overhaul
- Plant Context: A specialty dye intermediate plant in Vatva GIDC operating an 80 m³/h, 40 m head chemical pump transferring 33% HCl.
- Problem: The pump consumed 18.5 kW but delivered only 62 m³/h; calculated operating efficiency had dropped from 72% to 51%, wasting thousands in electrical power.
- Root Cause: Abrasive particulate slurry had enlarged the internal PTFE wear ring clearance from 0.25 mm to 0.95 mm, causing massive internal bypass.
- Action Plan: Teflow Pumps engineering team:
- Overhauled rotating assembly in our Ahmedabad workshop. - Replaced worn wear ring with a precision-machined monolithic SSiC wear ring set (0.22 mm clearance). - Dynamically balanced impeller to ISO 5199 Grade G2.5 and laser aligned coupling.
- Outcome: Pump operating efficiency restored to 73.4%; electrical power draw dropped from 18.5 kW to 13.1 kW, saving over 3.6 lakh INR annually in electricity bills; overhaul investment paid back in 48 operating days.
Case 2: Narol Continuous Textile Stenter Caustic Pump Efficiency Audit
- Plant Context: A textile processing mill in Narol operating a caustic circulation pump (50 m³/h, 30 m).
- Problem: Operating efficiency degraded to 48% due to heavy scale encrustation in the volute.
- Action Plan: Grit-blasted casing volute and applied a smooth hydrophobic ceramic coating.
- Outcome: Efficiency improved to 68%; saved 4.2 kW continuous power (2.8 lakh INR/year).
Case 3: Odhav Effluent Treatment Plant Centrifugal Pump Energy Optimization
- Plant Context: An industrial CETP in Odhav pumping wastewater to biological clarifiers.
- Problem: Two 45 kW pumps operated at 52% efficiency due to oversized impellers running in throttled bypass.
- Action Plan: Sized and trimmed impellers by 12% to match actual system head curve without throttling.
- Outcome: Pump efficiency jumped to 71%; eliminated 18 kW wasted throttling power across both pumps.
Case 4: Surat Specialty Chemical High-Flow Cooling Water Pump Refurbishment
- Plant Context: A synthetic fiber plant in Surat operating cooling tower circulation pumps (500 m³/h, 110 kW).
- Problem: Efficiency dropped by 11% due to cavitation blade erosion over 3 years of service.
- Action Plan: Replaced eroded impeller with an investment cast SS316 impeller and balanced to Grade G2.5.
- Outcome: Restored full 81% BEP efficiency; annual energy savings exceeded 7.2 lakh INR.
Case 5: Ankleshwar GIDC Pharma Solvent Circulation Energy Recovery
- Plant Context: A bulk drug synthesis unit in Ankleshwar GIDC circulating organic solvents.
- Problem: Chronic seal friction drag and misaligned coupling caused 8% parasitic power loss.
- Action Plan: Installed low-friction monolithic SSiC mechanical seal and performed precision dual-laser shaft alignment.
- Outcome: Eliminated parasitic drag; bearing operating temperature dropped from 88°C to 52°C.
Case 6: Dahej PCPIR Petrochemical Wastewater Pump Efficiency Upgrade
- Plant Context: A petrochemical facility in Dahej PCPIR operating effluent transfer pumps (250 m³/h, 75 kW).
- Problem: Degraded rewound motor operated at 84% efficiency with power factor \cosφ = 0.74.
- Action Plan: Upgraded to an IE4 super-premium efficiency motor (96.2% efficiency, \cosφ = 0.88).
- Outcome: Total wire-to-water efficiency increased by 14%; saved over 68,000 kWh annually.
9. Comprehensive Master Pump Efficiency Verification Checklist
Execute this hydraulic and electrical audit protocol to calculate pump efficiency and spot mechanical wear:
Centrifugal Pump Efficiency Calculation & Wear Audit Protocol
10. Summary & Specialized Pump Overhaul Services in Gujarat & India
Calculating and optimizing centrifugal pump efficiency—mastering hydraulic-to-shaft power math, auditing wire-to-water electrical performance, diagnosing internal wear ring clearances, restoring smooth volute profiles, and dynamically balancing rotating assemblies to ISO 5199 Grade G2.5 across Vatva GIDC, Narol, Odhav, Surat, Ankleshwar, and Dahej—conforming to ISO 5199, ISO 2858, and DIN 24255 standards—is the proven engineering standard for process plant reliability and energy reduction.
Partnering directly with an established Gujarat rotating machinery manufacturer provides chemical plant maintenance engineers, energy managers, and utility superintendents with immediate technical access to on-site thermodynamic audit teams, True-RMS electrical power analyzers, ultrasonic flow meters, dynamic balancing facilities, and genuine spares dispatched directly from our Ahmedabad factory. Our technical engineers provide emergency on-site troubleshooting, turnkey pump overhauls, and complete efficiency restoration overhauls.
Teflow Pumps operates a specialized industrial machinery manufacturing and service facility in Ahmedabad, providing emergency centrifugal pump overhauls, wear ring refurbishment, impeller trimming calculations, precision laser alignment, dynamic balancing, custom casting, and genuine rotating equipment spares across Gujarat and India conforming to ISO 5199, ISO 2858, DIN 24255, and IS 5120 standards.
- Direct Technical & Emergency Helpline: +91 98251 62709
- WhatsApp Technical Desk: Share flow rates (Q_m³/h), total head (H_meters), fluid specific gravity (SG), measured three-phase electrical power (kW), pump nameplate photos, or efficiency deficit symptoms to wa.me/919825162709 for immediate technical review, efficiency calculation, and formal quotation.
- Request an On-Site Pump Efficiency Audit & Overhaul: Contact our senior rotating equipment engineers for emergency plant surveys, efficiency restoration proposals, and formal quotation. Our engineering team conducts comprehensive thermal evaluations, verifies ISO 5199 criteria, provides precision on-site or workshop reconditioning, and dynamically balances overhauled hot oil pumps to ensure maximum uptime across Gujarat's textile and chemical processing mills. We provide rapid technical evaluations, on-site plant surveys, and formal quotes.